模型效果评估,召回率
准确率
召回率
| 指标 | 定义与描述 | 示例场景 |
|---|---|---|
| TP(True Positive) | 真实类别为正类,且被模型正确预测为正类的样本数量。 | 疾病检测中,真实患病且被模型诊断为阳性的患者数量17。 |
| TN(True Negative) | 真实类别为负类,且被模型正确预测为负类的样本数量。 | 垃圾邮件分类中,正常邮件被正确识别为非垃圾邮件的数量46。 |
| FP(False Positive)* | 真实类别为负类,但被模型错误预测为正类的样本数量。 | 安防系统中,将正常行为误判为异常事件的数量(误报)17。 |
| FN(False Negative | 真实类别为正类,但被模型错误预测为负类的样本数量。 | 医学影像分析中,漏诊癌症病例的数量(漏报)37。 |
核心指标公式
| 指标名称 | 公式定义 | 应用场景 |
|---|---|---|
| **准确率(Accuracy)** | Accuracy=(TP+TN)/(TP+TN+FP+TN) | 评估整体预测正确率,适用于类别均衡的数据集45 |
| **召回率(Recall)** | Recall=TP/(TP+FN) | 关注正样本的覆盖能力(如疾病筛查、搜索召回)16 |
| **精确率(Precision)** | Precision=TP/(TP+FP) | 关注预测结果的准确性(如垃圾邮件过滤)16 |
| **F1值(F1-Score)** | F1=(2×Precision×Recall) / (Precision+Recall) | 综合精确率与召回率,用于类别不均衡数据56 |
| **IOU(交并比)** | IOU=交集面积 / 并集面积 | 目标检测中评估预测框与真实框的重叠度,值越接近1越好7 |
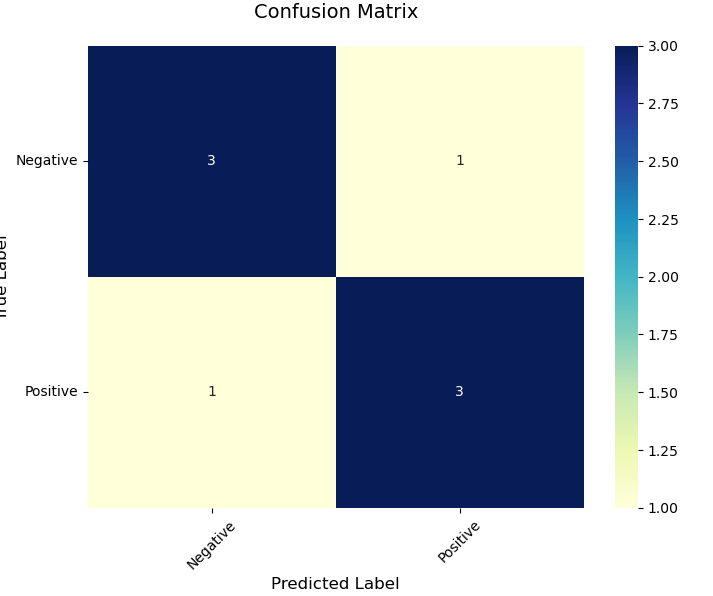
confusion_matrix
plot_confusion_matrix
1 | import numpy as np |
Seaborn
1 | import seaborn as sns |